Increase sales with flexible payments from Affirm
The article discusses how integrating Affirm's flexible payment options can help businesses increase sales and customer acquisition by offering buy now, pay later solutions that enhance purchasing power and improve customer experience.
By default, we use third-party cookies in order to personalize your experience. Read our Cookie Policy.
Accept
Preferences
Manage Consent Preferences
Essentials
Always active
Necessary for the site to function. Always On.
Analytics
Analytics
Measures usage and improves your experience.
Marketing
Marketing
Used for targeted advertising.
Personalization
Personalization
Remembers your preferences and provides enhanced features.
The GPC signal has been honored.
Reject All
Accept All
Thank you! Your submission has been received!
Oops! Something went wrong while submitting the form.
Preferences
Join 1,000+ industry leaders at Tektonic 2027. Early bird pricing is now open.
See how Metro Motor grew their average repair order to $800 across 19 shops with Tekmetric
Under the Lift: Stories from the Automotive Frontier (New Episode)
Register Now Read the Story Watch Now
Capture more sales and boost customer acquisition with flexible payments from Affirm
|
July 2, 2024
|
Read time: 3 min
.webp)
 \
Add as a preferred source on Google
\
Add as a preferred source on Google
Latest Posts
Reading the ARO Gaps Among Your Shops
How to Deliver a Consistent Auto Repair Customer Experience Across Every Location
Auto Repair Platform Features that Actually Matter
Grow Every Multi-Shop Location
table of contents
Payment methods aren’t simply about an exchange of money. They're personal. And in the ecommerce environment, offering the right payment methods is like extending an invitation — it lets your customers know they're welcome here and they can expect a seamless experience.
Buy now, pay later (BNPL) methods provide even more convenience and flexibility, allowing customers to break their purchases into smaller payments. When you add BNPL to your menu of payment options, you open the door to even more customers and to higher-value sales. In fact, a recent survey found that more than 70% of businesses using BNPL report higher conversions, average order value, and customer acquisitions.
We've partnered with Stripe to make Affirm’s BNPL payment methods available to your customers. Businesses that offer BNPL through Stripe on average see a 24.5% increase in sales. Adding Affirm to your mix of payment methods can help your business:
1. Boost Conversion
A $400 price tag, for example, might discourage some customers from clicking buy, but when they can split that cost into four $100 payments, the transaction may be more appealing. That's how BNPL methods can help motivate your customers to make an order, driving up your conversion rate.
2. Increase Your Average Order Value
BNPL methods may encourage your customers to order more lower-value goods at one time, increasing your average cart size. It may also encourage them to purchase high-value goods, such as luxury items or furniture. In either case, your customers have greater ability to place higher-value orders, which can help drive revenue.
3. Reach More Customers
BNPL methods can help you tap into new market segments by making a purchase easier on a customer's budget through a series of smaller payments. These payment methods are especially attractive to younger customers who may not have a credit card or the ability to pay for large purchases in a single payment.
The flexibility of buy now, pay later is a huge benefit to your customers—one that can inspire them to make a purchase. And—maybe the best part—this all happens without extra work on your part, and Affirm takes on any potential risk.
With Affirm, you get paid in full immediately, while your customer owes only a portion or nothing up front. Affirm handles underwriting the customer and collecting payments, and assumes liability if a customer files a fraud-related dispute, so you can focus on growing your business.
Click here to learn more about how Tekmetric and Stripe can help you optimize your checkout
👉 Ready to grow your automotive business? [Book a personalized Tekmetric Demo Here]
FAQ
More articles
Do you ever wish you could see into the future? As a business owner, being able to predict how much business you will get during a week, a month, or a year can help you make important decisions regarding marketing your services, taking on more work, hiring more employees, or even knowing when to expand your business.
Of course, there are always going to be unforeseen situations. No matter how much technology you have, there’s no surefire way to predict accidents, natural disasters, or other changes in life circumstances. Fortune telling aside, shop owners can use real-time reports to forecast the health of their business and get a sense of how much money their garage is expected to make before the end of a week, month, or year.
Here’s how you can leverage two of Tekmetric’s real-time reports in combination to forecast your shop’s performance and test the decisions you make as a shop owner.

Thought Leadership
How Auto Repair Shops Can Plan Ahead With Real-Time Reports
August 18, 2023
Read time: 1 min
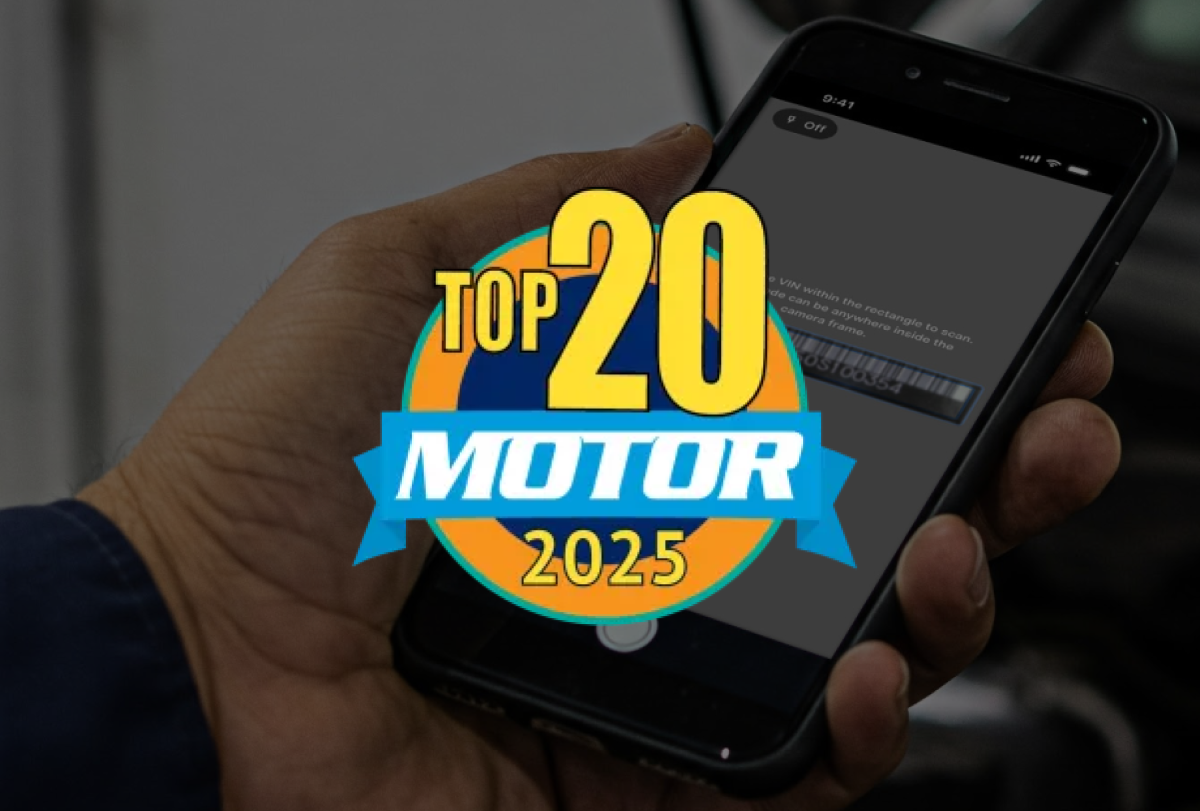
We’re proud to share that the Tekmetric Mobile App has been named a winner of the 2025 MOTOR Top 20 Award, an honor that recognizes the 20 most innovative and impactful tools and technologies shaping the automotive industry.
For decades, the MOTOR Top 20 Awards have been a benchmark for excellence, celebrating advancements that help technicians work more efficiently and shop owners operate more profitably. To be included on this list is a powerful acknowledgment of our team’s commitment to solving real challenges for repair shops
The Tekmetric Mobile App was designed to make shop management easier and more effective. By streamlining workflows, enhancing communication, and providing shop owners with the real-time insights, the app equips teams to deliver a better customer experience while running a more profitable business..
Tek-Tip: Learn more about the Tekmetric Mobile App. Now available in the Apple and Google App stores.
This recognition wouldn’t be possible without the thousands of shop owners, service advisors, and technicians who share their feedback with us every day. Your trust pushes us to keep improving, and this award reflects both your partnership and our team’s dedication to moving the industry forward.
As we look ahead, we are more motivated than ever to build solutions that give repair shops the horsepower to grow, the efficiency to scale, and the tools to deliver service with confidence.
To learn more about the MOTOR Awards and view the 2025 Top 20 Awards, visit https://www.motor.com/2025/09/motor-announces-2025-top-20-awards-winners/
About Tekmetric
Tekmetric, the leading auto repair technology company, improves auto repair shops through the relentless pursuit of innovation. Tekmetric’s all-in-one cloud-based auto repair platform, including shop management, payments, marketing, technology integrations, and real-time data, empowers auto repair shops nationwide. With Tekmetric, shop owners can create transparency, enhance productivity, increase profitability, and deliver a superior customer experience for vehicle owners.
Tekmetric Community
Tekmetric Mobile App Wins 2025 MOTOR Top 20 Award
September 4, 2025
Read time: 2 min
In an era where digital solutions are rapidly transforming industries, the auto repair space is no exception. Fortunately, in addition to increasing efficiency and streamlining customer service, this growing reliance on digital systems also offers an opportunity to enhance transparency. Transparency is essential to building trust and empowering vehicle owners with the knowledge they need to make informed decisions regarding repairs. When leveraged correctly, digital solutions can bridge the gap between auto repair shops and customers, creating opportunities for transparency from the moment the customer brings the vehicle to your shop to the final payment and pick-up.
Using Technology to Educate Your Customers
In an industry where trust is paramount, educating your customers is one of the best value-adds you can offer. When done conveniently and thoroughly, education can help the customer better understand their vehicle’s problems, the necessity of the proposed repairs and what additional repairs need immediate attention. This in turn allows them to make the best decision for the health of their vehicle and their safety as the driver.
Digital solutions can play a significant role in educating customers. In conjunction with the technicians who complete the repair, service advisors are in a unique position to educate the customer about their vehicle and repairs. When the service advisor takes the time to clearly share the technician’s diagnosis and proposed repairs, the customer can better understand where their money is going. Digital solutions can help streamline this process, which makes customers more likely to approve repairs – ultimately driving your average repair order. Some digital solutions include:
- Digital Vehicle Inspections. Aside from cost, customers care about two things when it comes to repairs: what repair is needed to get the car back on the road, and how long it will take. DVIs fulfill both needs – and they provide the information in a digital format the customer can easily access and understand. With the right mix of photos and videos sent to the customer, vehicle owners can see the healthy and unhealthy parts of their vehicle. By using DVIs as a tool to educate your customers clearly and conveniently, you can foster a relationship based in trust and transparency from the beginning.
- MotoVisuals. Tekmetric’s MotoVisuals integration makes explaining tricky car problems easy. MotoVisuals offers a wide selection of simple-to-follow animated videos about general vehicle repairs to accompany your DVI. By sharing a MotoVisuals video with the vehicle owner, you can leverage top-notch visuals to effortlessly explain repairs without confusing tech jargon. This can help make it an easy “yes” for the vehicle owner when it comes to approving repairs.
Building Trust by Meeting Customers Where They Are
A big part of establishing transparency in your shop is creating convenience for your customers. Through convenient digital tools, you can share information with customers easily and clearly in a format they can access anytime, anywhere. For example, by facilitating a convenient, two-way digital conversation, you can share repair updates and answer questions all through a simple text. You can even share photos and videos to further illustrate your recommendations. When customers can text you and get immediate responses, they can rest assured that your shop will meet their needs in an efficient manner.
At Tekmetric, two-way texting and text-to-pay both build on convenience through transparent communication, from repair questions to financial needs and payment options:
- Two-way texting. Two-way texting allows for open communication between your shop and the customer in a format that is accessible anytime, from anywhere. Nearly all parts of the repair process can be completed via text, from sharing DVIs to gaining customer approvals. Customers can view images of their car and ask questions, and the service advisor can respond with clear explanations or even share videos through MotoVisuals. This also creates a simple, transparent record of the repair process, including time and date stamps, whether a customer viewed the message and more.
- Text-to-pay. Vehicle repairs are often one of the most expensive purchases a customer can make. Therefore, it’s important to offer financial options that are easy to access, so they can easily review the invoice and submit payment. Text-to-pay provides the tools shop owners need to offer a seamless, convenient payment experience for customers, while keeping data secure and fully integrated into the Tekmetric system.
Establishing Transparency Through Secure Digital Payment Options
Transparency is critical from start to finish in the auto repair process. You work hard to establish and build trust with the vehicle owner throughout the repair – so it’s crucial to maintain the same level of transparency at the final touchpoint: the payment. After the repair, you should offer a secure form of payment your customer will be able to review, clearly understand and complete in a format that is easiest for them.
- Buy Now, Pay Later. When it comes to finances, most repairs are surprise purchases for vehicle owners. Even with a budget, there is no way a customer can anticipate the exact cost of the necessary repair ahead of time. By offering payment installment options through Buy Now, Pay Later, shop owners can demonstrate transparency about the total cost of the repairs while providing options for financing so the customer can complete the repair while adhering to their budget.
- Integrated Payments. Shops run more efficiently with integrated payments due to a visible, centralized location. Integrated payments allow customers to pay without being at the shop or needing a physical credit card. Within one click, the customer can pay, streamlining the final part of the customer experience and maximizing the shop’s workflow through a quick and painless payment process.
Transparency fosters greater trust and loyalty between auto repair shops and vehicle owners. By providing clear and open communication throughout the auto repair process, shops can build stronger relationships, gain new business and increase customer satisfaction. The more transparent you are, the greater the vehicle owner’s trust in your shop. This enhances your reputation and your business performance, leading to more customers, an excellent customer experience and ultimately greater profitability.

Shop Management
Customer Experience
Enhancing Customer Transparency with Digital Solutions
September 30, 2024
Read time: 5 min

Request a personalized demo now
experience
Tekmetric in Action
.svg)


.svg)

.svg)
.svg)
.svg)
.svg)
.svg)
.svg)
Platform
Features
- Digital Vehicle Inspections
- Estimate Building
- Parts & Inventory
- Phones
- Reporting
- Payment Processing
- Invoicing
- Text-To-Pay
- Buy Now, Pay Later
- Capital Financing
- Online Booking
- Automated Reminders
- Scheduled Campaigns
- Two Way Texting
- Google Reviews
- Websites
Resources
Support
- help center
- Contact Us
- Tek User Group
- Faqs
- System Status
- Email Preferences
- Brand Assets
- Trust Center
company & Legal
-
Careers we are hiring!
×